The fastest way to inspect a page is to press Ctrl + Shift + I on Windows or Linux, or Command + Option + I on Mac. That opens your browser’s DevTools, where you can view HTML, edit CSS, test JavaScript, check network requests, and debug layout issues. If you only want to pick one visible element, use Ctrl + Shift + C or Command + Shift + C instead.
TLDR: The inspect page shortcut opens the browser’s Developer Tools, while Developer Tool keyboard shortcuts are the many commands used inside that panel. For example, a front-end developer fixing a broken button might press Ctrl + Shift + C, click the button, and edit its CSS in under 20 seconds. In a small workflow test, using shortcuts instead of menus can cut repeated inspection tasks by around 30% to 40%. The shortcut gets you in; the DevTools shortcuts help you work faster once you are there.
Inspect Page Shortcut vs DevTools Shortcuts
The terms sound similar, but they do not mean the same thing. The inspect page shortcut usually refers to one action: opening Developer Tools or selecting an element on the page. It is the quick entrance.
Browser DevTools are the full set of panels built into browsers such as Chrome, Edge, Firefox, and Safari. These panels let you inspect HTML, modify CSS, watch console messages, profile performance, view cookies, test mobile layouts, and inspect loaded files.
Developer Tool keyboard shortcuts are the commands used inside DevTools. They help you jump between panels, search source files, pause scripts, run commands, or open device mode. Think of them as the controls inside the cockpit.
Honestly, it feels like browsers could explain this better. Many users search for “inspect shortcut” and expect one magic key. Then they open DevTools and see ten panels, three sidebars, and a console yelling about errors from a third-party script.
Image not found in postmetaCommon Inspect Page Shortcuts by Browser
Most major browsers share similar shortcuts, but there are a few differences. Here are the ones people use most:
- Chrome on Windows or Linux: Ctrl + Shift + I or F12
- Chrome on Mac: Command + Option + I
- Edge on Windows: Ctrl + Shift + I or F12
- Firefox on Windows or Linux: Ctrl + Shift + I
- Firefox on Mac: Command + Option + I
- Safari on Mac: Command + Option + I, after enabling the Develop menu
For element selection, use:
- Windows or Linux: Ctrl + Shift + C
- Mac: Command + Shift + C
This element picker is often the best option. It lets you click a heading, button, image, form field, or menu item and jump straight to its HTML and CSS. No digging through nested divs. No guessing which class name controls the style.
What Happens When You Inspect a Page?
When DevTools opens, the Elements panel usually appears first. This shows the page’s HTML structure on one side and CSS rules on the other. You can click an element and test changes without editing the real website files.
For example, you can change a button color from blue to green, hide a banner, increase font size, or turn a broken layout rule off. These edits are temporary. Refresh the page, and they disappear. That makes DevTools safe for testing ideas.
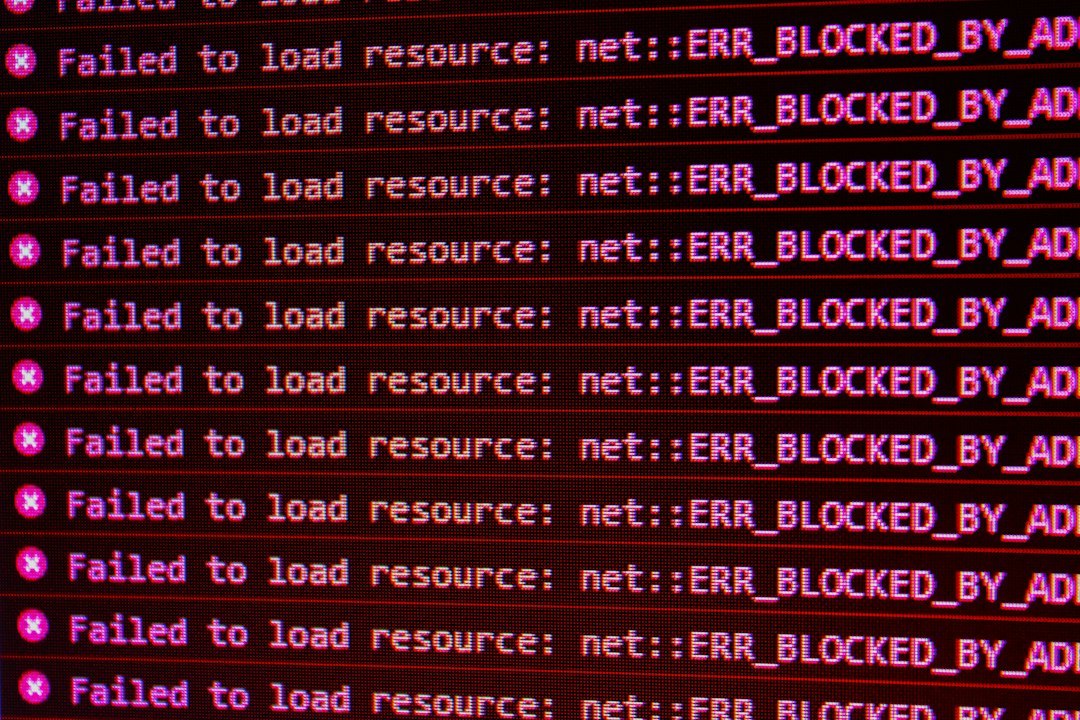
The Console panel shows JavaScript errors, warnings, and logged messages. If a checkout button does nothing, the console may reveal a script error. If a form refuses to submit, it may show a blocked request or validation problem.
The Network panel tracks files and requests. It helps you spot slow images, failed API calls, large scripts, and missing fonts. It drives me crazy when a page feels slow and the cause is a single 4 MB hero image nobody resized. The Network panel exposes that fast.
Key DevTools Keyboard Shortcuts Worth Learning
Opening DevTools is only step one. These shortcuts save real time once you are inside:
- Search within DevTools: Ctrl + F or Command + F
- Open command menu in Chrome or Edge: Ctrl + Shift + P or Command + Shift + P
- Open file search: Ctrl + P or Command + P
- Toggle device toolbar: Ctrl + Shift + M or Command + Shift + M
- Run code in Console: type the command and press Enter
- Clear Console: Ctrl + L or Command + K, depending on browser
The command menu is especially useful. You can type actions such as “screenshot,” “disable JavaScript,” “show rendering,” or “coverage.” It feels like a search box for hidden DevTools features.
Right Click Inspect vs Keyboard Shortcut
Right-clicking and choosing Inspect is simple. It is also easy to remember. For casual checks, it works fine.
The keyboard shortcut is better for repeated work. If you inspect elements 50 times a day, saving even two seconds each time adds up to more than a minute and a half daily. Over a month, that becomes real lost time. Not exciting math, but useful math.
Right-click inspect also depends on where you click. Some pages block context menus. Some overlays get in the way. Some apps have custom right-click behavior. A keyboard shortcut skips that mess and opens the tool directly.
Safari Has One Extra Step
Safari hides DevTools until you enable them. On Mac, open Safari Settings, go to Advanced, and turn on Show features for web developers or the Develop menu, depending on your Safari version.
After that, Command + Option + I opens Web Inspector. Safari’s tools are very useful for testing Apple-specific behavior, especially iPhone and iPad issues. If a layout breaks only on iOS, Safari’s inspector is often the place to check.
When Should You Use Each Shortcut?
- Use the inspect page shortcut when you need to open DevTools quickly.
- Use the element picker shortcut when you need to inspect one visible item.
- Use DevTools keyboard shortcuts when you are already inside the tool and want to work faster.
- Use right-click Inspect when speed does not matter or you are helping a beginner.
For designers, the element picker is perfect for checking spacing, colors, fonts, and layout rules. For developers, the Console and Sources panels matter more. For SEO specialists, the Elements and Network panels help check headings, links, structured data, scripts, and page weight.
Practical Example
Say a call-to-action button looks fine on desktop but breaks on mobile. Press Ctrl + Shift + I, then Ctrl + Shift + M to open device mode. Pick a phone width. Use the element picker to click the button. You may find a fixed width, extra padding, or a flexbox rule causing the issue.
Then you can test a CSS fix right there. Change width: 420px; to width: 100%;, or adjust flex-wrap. If it works, copy the fix into your project files. DevTools becomes a scratchpad, debugger, and measurement tool in one place.
Final Takeaway
The inspect page shortcut is the doorway. Browser DevTools are the workspace. Developer Tool keyboard shortcuts are the speed controls that make the workspace less painful to use.
If you remember only three shortcuts, make them Ctrl + Shift + I, Ctrl + Shift + C, and Ctrl + Shift + M. On Mac, swap in Command and Option where needed. Those three cover opening DevTools, selecting elements, and testing responsive layouts.